
Where Trump beat Biden in 2020, his margin of victory was often wide. Listed below are the states where Trump prevailed, in order of his relative popularity. The results show where Democrats are least competitive, where Trump prevails because of an absence of viable competition.
After that is a second list, of the ten states most closely decided in 2020. In four states (Georgia, Arizona, Wisconsin, and Pennsylvania), Biden prevailed by a margin of less than one percent. Had these states gone the other way, Trump would still be president.
The political crisis of the United States will resolve when a rival party becomes ideologically competitive in the many states where Trump dominated comfortably last time around. Many of these states are small. How to woo votes away from Trump in these areas is an experiment worth embarking on prior to the election of 2024.
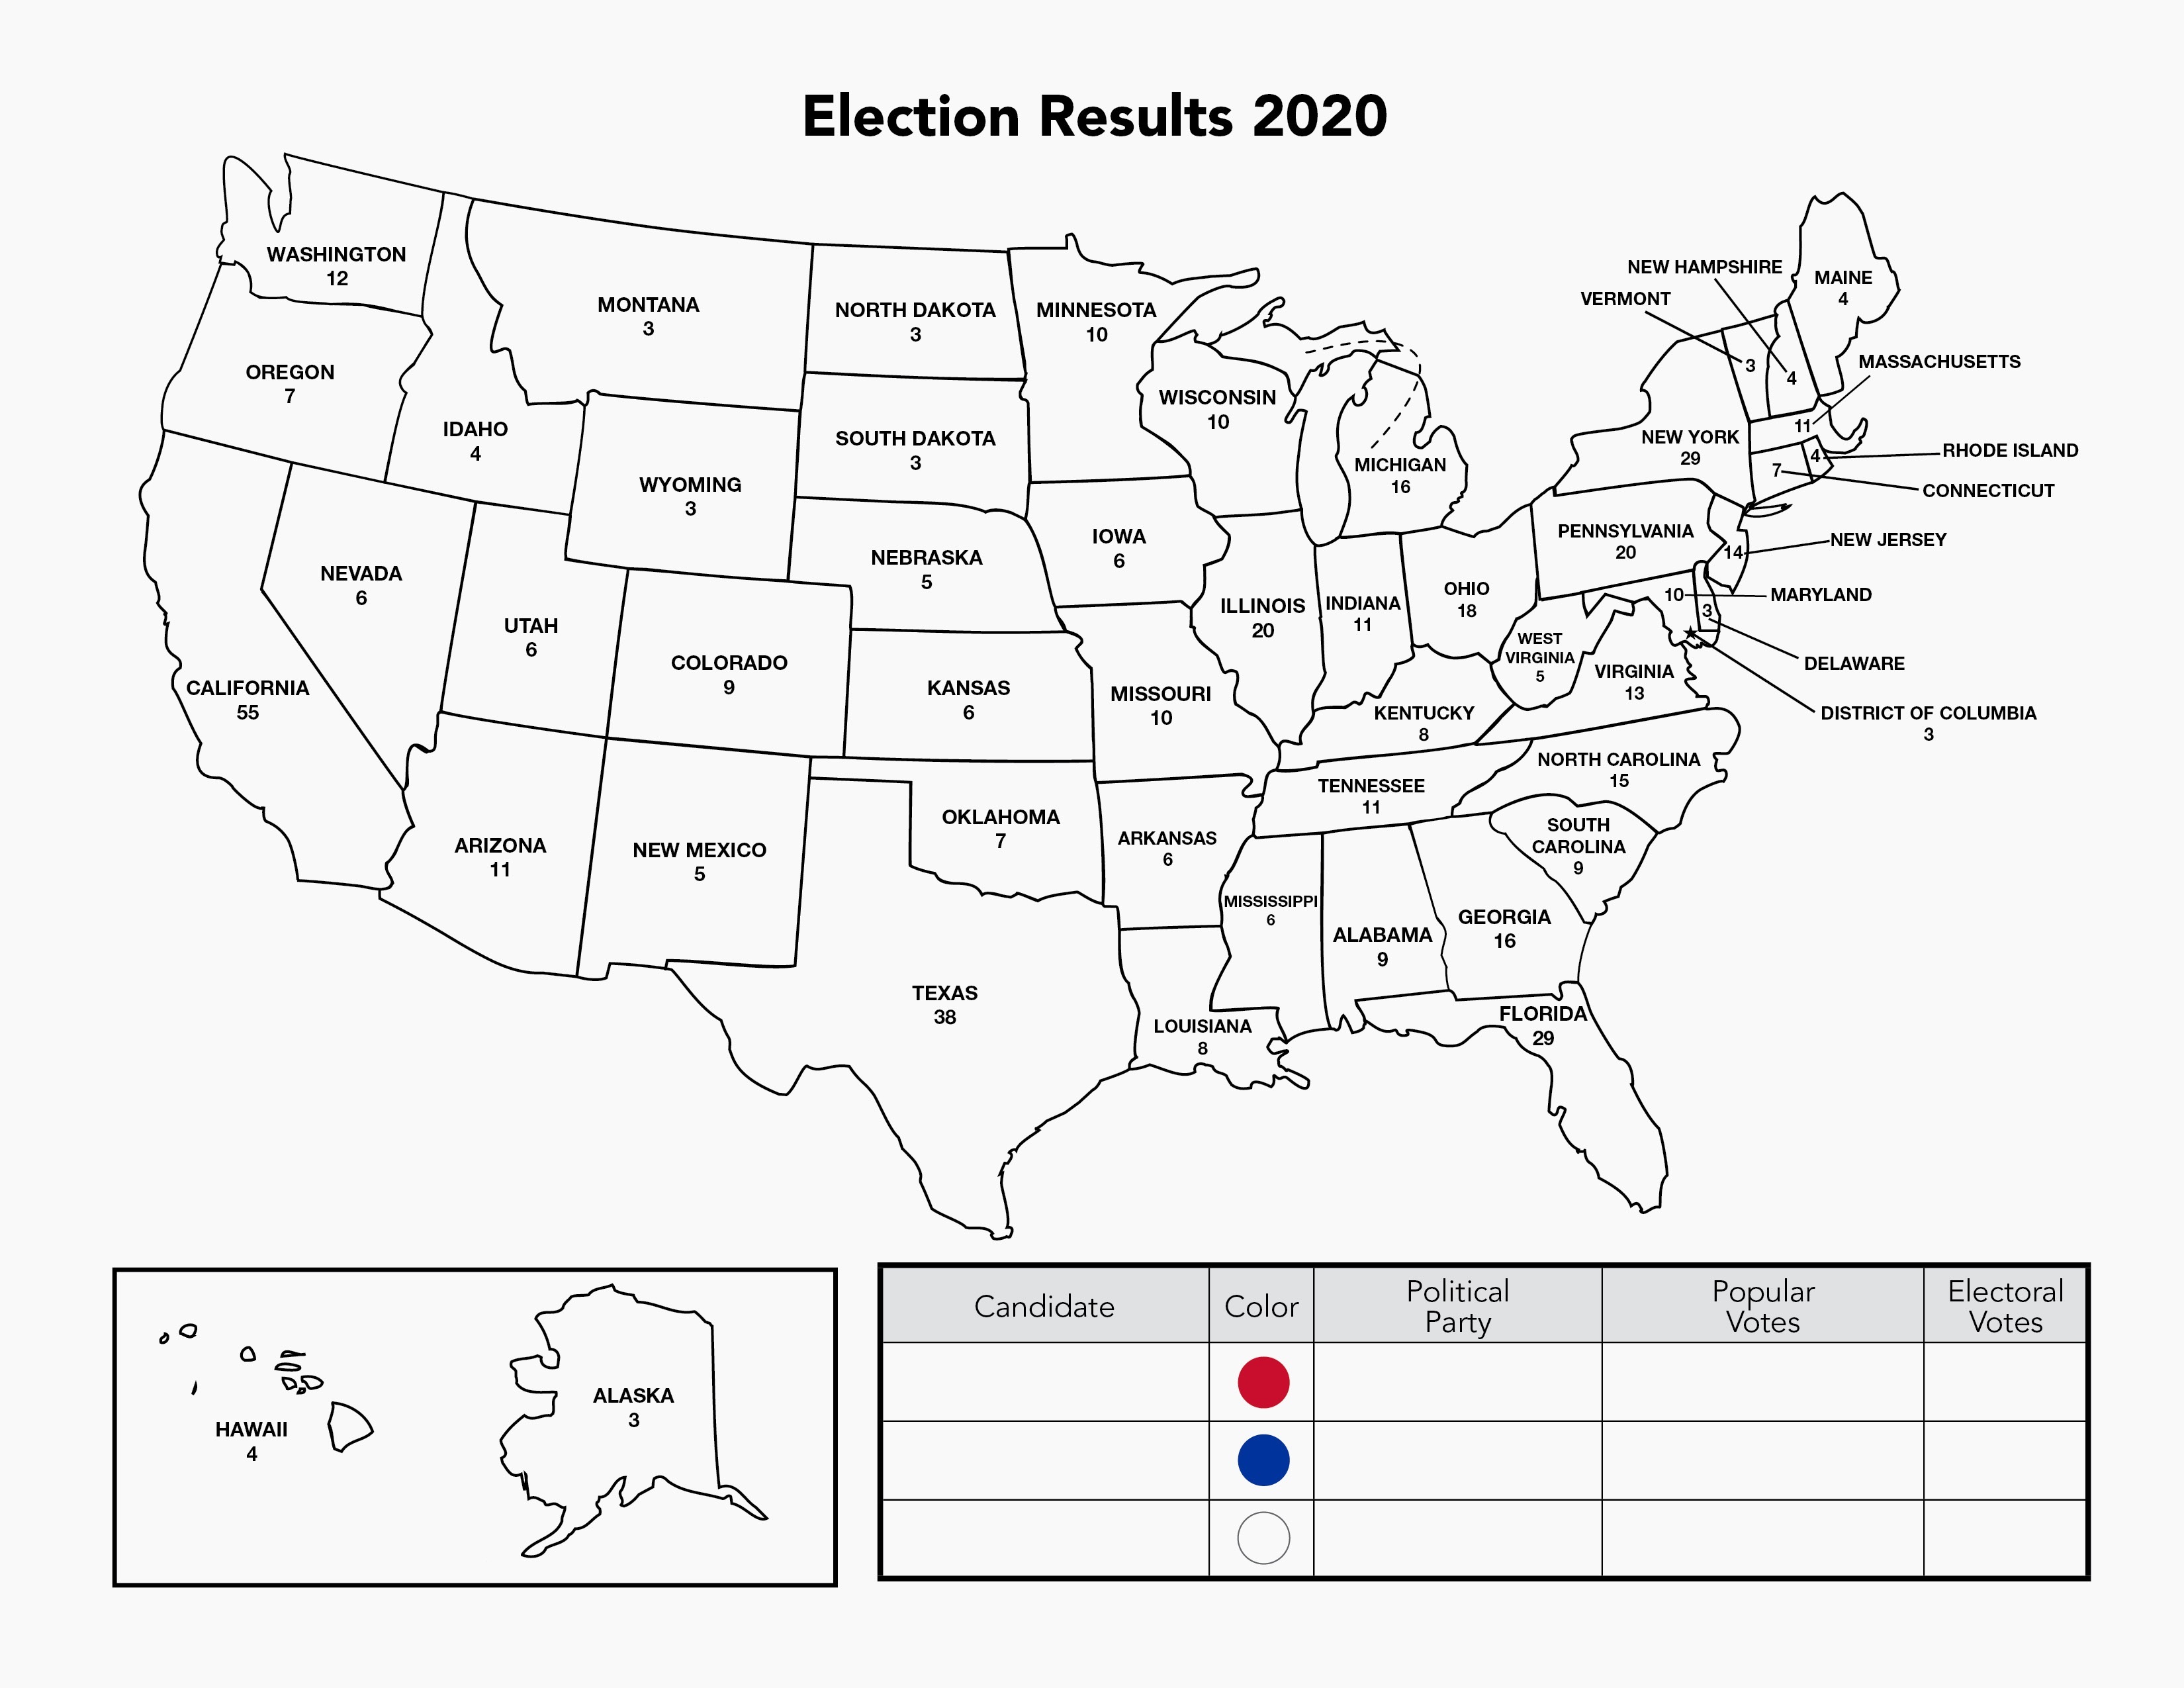
KEY: State (Electoral votes) NUMBER OF VOTES CAST FOR TRUMP / Margin of victory
-
- Wyoming (3) 193,559 / 43.3 %
- West Virginia (5) 545,382 / 38.9 %
- North Dakota (3) 235,595 / 33.3 %
- Oklahoma (7) 1,020,280 / 33.1 %
- Idaho (4) 554,119 / 30.8 %
- Arkansas (6) 760,647 / 27.6 %
- South Dakota (3) 261,043 / 26.2 %
- Kentucky (8) 1,326,646 / 25.9 %
- Alabama (9) 1,441,170 / 25.4 %
- Tennessee (11) 1,852,475 / 23.2 %
- Utah (6) 865,140 / 20.5 %
- Nebraska (4/5) 556,846 / 19.1 %
- Louisiana (8) 1,255,776 / 18.6 %
- Mississippi (6) 756,764 / 16.5 %
- Montana (3) 343,602 / 16.4 %
- Indiana (11) 1,729,516 / 16 %
- Missouri (10) 1,718,736 / 15.4 %
- Kansas (6) 771,406 / 14.6 %
- South Carolina (9) 1,385,103 / 11.7 %
- Alaska (3) 189,951 / 10 %
- Iowa (6) 897,672 / 8.2 %
- Ohio (18) 3,154,834 / 8.1 %
- Texas (38) 5,890,347 / 5.6 %
- Florida (29) 5,668,731 / 3.3 %
- North Carolina (15) 2,758,775 / 1.3 %
- Maine (1/4) 360,737* / -9.1 %
*Votes garnered in Maine gave Trump 1 electoral vote out of a possible four.
The most closely contested states in 2020: Biden’s narrowest margins
-
- Georgia (16) B by 0.2 %
- Arizona (11) B by 0.6 %
- Wisconsin (10) B by 0.6 %
- Pennsylvania (20) B by 0.7 %
- North Carolina (15) T by 1.3 %
- Michigan (16) B by 2.6 %
- Nevada (6) B by 2.7 %
- Florida (29) T by 3.3 %
- Texas (38) T by 5.6 %
- Minnesota (10) B by 7.1 %
- New Hampshire (4) B by 7.1 %
SOURCES
Vote totals from https://www.archives.gov/electoral-college/2020
Margins from https://cookpolitical.com/2020-national-popular-vote-tracker
Downloadable blank outline map from JFK Library

WHY NOT SUPPORT AMERICAN INQUIRY?
Your donation helps ensure that American Inquiry remains freely available instead of hidden behind a paywall. Contributions can be given in $10 increments by using the quantity button. Your total will appear on the subsequent payment page. Many thanks!
$10.00